(1) 欧洲凶杀率的下降 The European Homicide Decline |
人性中的善良天使
1 /
5
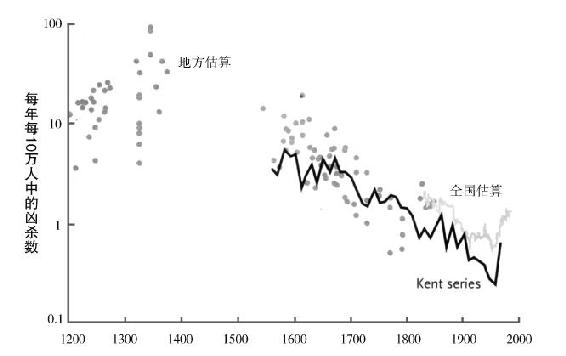
Before we try to explain this remarkable development, let's be sure it is real. Following the publication of Gurr's graph, several historical criminologists dug more deeply into the history of homicide. The criminologist Manuel Eisner assembled a much larger set of estimates on homicide in England across the centuries, drawing on coroners' inquests, court cases, and local records. Each dot on the graph in figure 3-2 is an estimate from some town or jurisdiction, plotted once again on a logarithmic scale. By the 19th century the British government was keeping annual records of homicide for the entire country, which are plotted on the graph as a gray line. Another historian, J. S. Cockburn, compiled continuous data from the town of Kent between 1560 and 1985, which Eisner superimposed on his own data as the black line.
查看中文翻译
…
…
…
>> 网页版功能未完善,完整内容,请扫码微信小程序。

(1) 欧洲凶杀率的下降 The European Homicide Decline
微信扫一扫,或者在微信中搜索【点学英语】公众号

 微信小程序
微信小程序